Plotly Charts
The MarkdownComponentPlotlyChart component allows you to create interactive charts and visualizations using Plotly.js library within chat messages. This component supports a wide variety of chart types including line plots, bar charts, scatter plots, heatmaps, and more.
Syntax
<MarkdownComponentPlotlyChart
  dataJSON='[{"x":[1,2,3],"y":[2,6,3],"type":"scatter","mode":"lines+markers","marker":{"color":"red"}},{"type":"bar","x":[1,2,3],"y":[2,5,3]}]'
  layoutJSON='{"width":320,"height":240,"title":{"text":"A Fancy Plot"}}'
/>Parameters
- dataJSON: A JSON string containing an array of Plotly data objects. Each object represents a trace (data series) in the chart
- layoutJSON: A JSON string containing the Plotly layout configuration object that controls the chart's appearance, sizing, and styling
Data Configuration
The dataJSON parameter accepts an array of trace objects. Each trace can have different properties depending on the chart type:
Common Properties:
- type: Chart type (e.g., "scatter", "bar", "line", "pie", "histogram", "heatmap")
- x: Array of x-axis values
- y: Array of y-axis values
- name: Legend label for the trace
- mode: For scatter plots ("lines", "markers", "lines+markers")
- marker: Styling options for markers (color, size, symbol)
- line: Styling options for lines (color, width, dash)
Layout Configuration
The layoutJSON parameter controls the overall chart appearance:
Common Layout Properties:
- title: Chart title configuration
- width: Chart width in pixels
- height: Chart height in pixels
- xaxis: X-axis configuration (title, range, tick settings)
- yaxis: Y-axis configuration (title, range, tick settings)
- showlegend: Whether to display the legend
- margin: Chart margins
- bgcolor: Background color
Examples
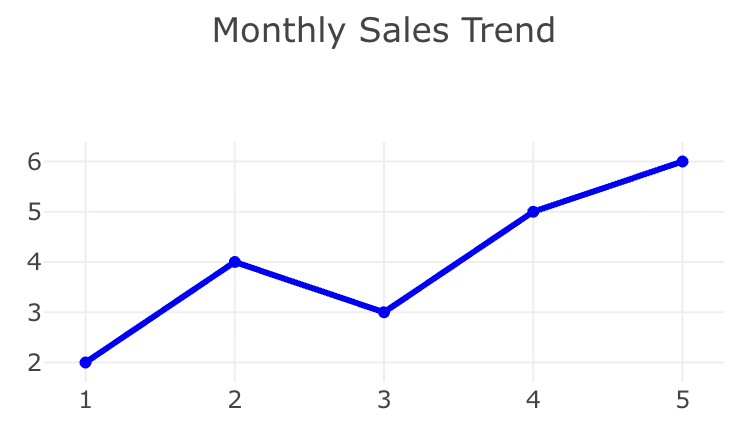
Line Chart
<MarkdownComponentPlotlyChart
  dataJSON='[{"x":[1,2,3,4,5],"y":[2,4,3,5,6],"type":"scatter","mode":"lines+markers","name":"Sales","line":{"color":"blue","width":3}}]'
  layoutJSON='{"title":{"text":"Monthly Sales Trend"},"xaxis":{"title":"Month"},"yaxis":{"title":"Sales ($)"},"width":500,"height":300}'
/>
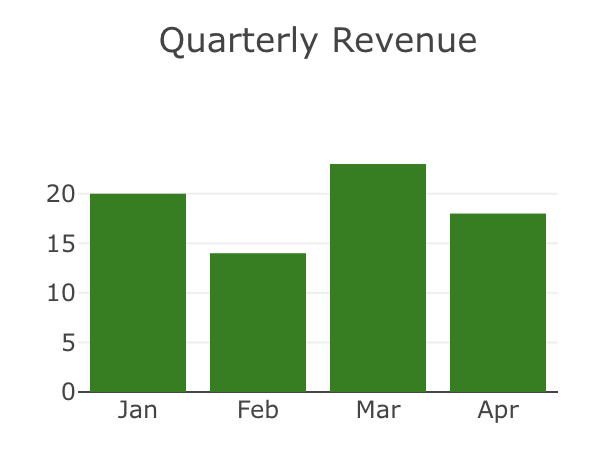
Bar Chart
<MarkdownComponentPlotlyChart
  dataJSON='[{"x":["Jan","Feb","Mar","Apr"],"y":[20,14,23,18],"type":"bar","marker":{"color":"green"}}]'
  layoutJSON='{"title":{"text":"Quarterly Revenue"},"width":400,"height":300}'
/>
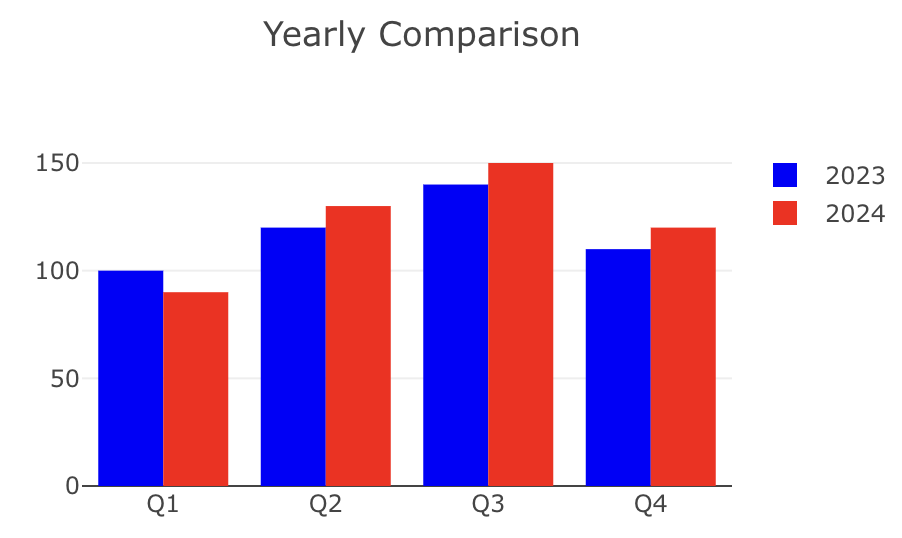
Multiple Series
<MarkdownComponentPlotlyChart
  dataJSON='[{"x":["Q1","Q2","Q3","Q4"],"y":[100,120,140,110],"type":"bar","name":"2023","marker":{"color":"blue"}},{"x":["Q1","Q2","Q3","Q4"],"y":[90,130,150,120],"type":"bar","name":"2024","marker":{"color":"red"}}]'
  layoutJSON='{"title":{"text":"Yearly Comparison"},"barmode":"group","width":500,"height":350}'
/>
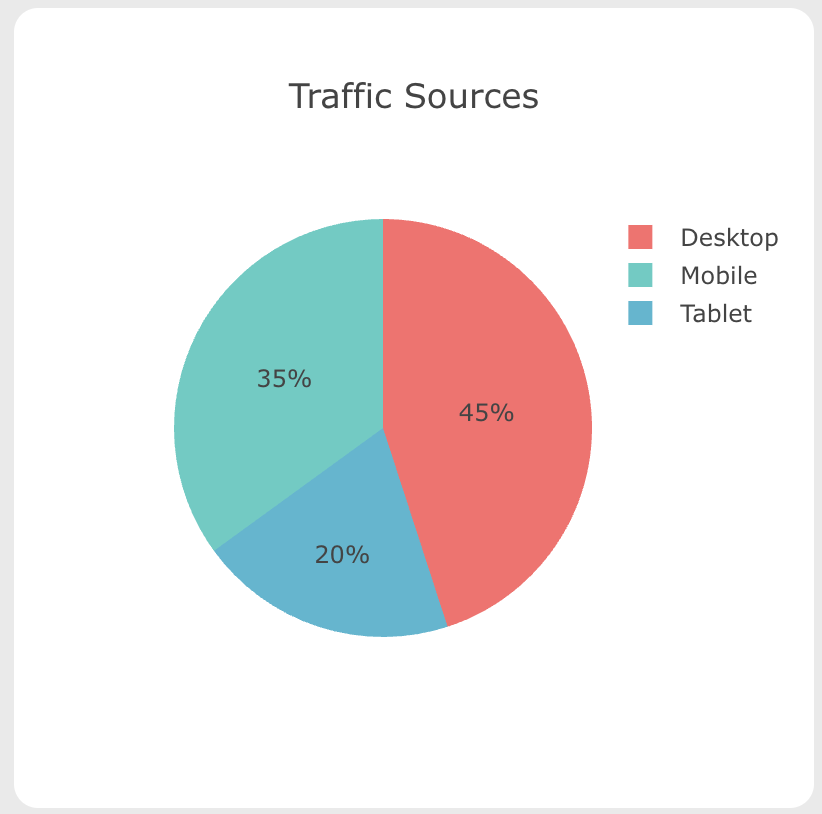
Pie Chart
<MarkdownComponentPlotlyChart
  dataJSON='[{"labels":["Desktop","Mobile","Tablet"],"values":[45,35,20],"type":"pie","marker":{"colors":["#FF6B6B","#4ECDC4","#45B7D1"]}}]'
  layoutJSON='{"title":{"text":"Traffic Sources"},"width":400,"height":400}'
/>
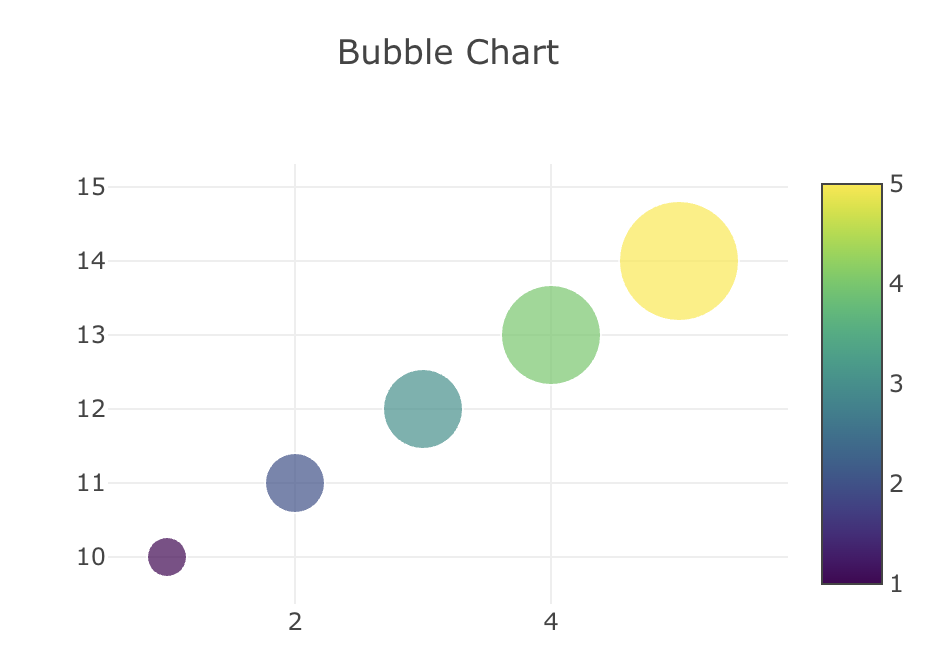
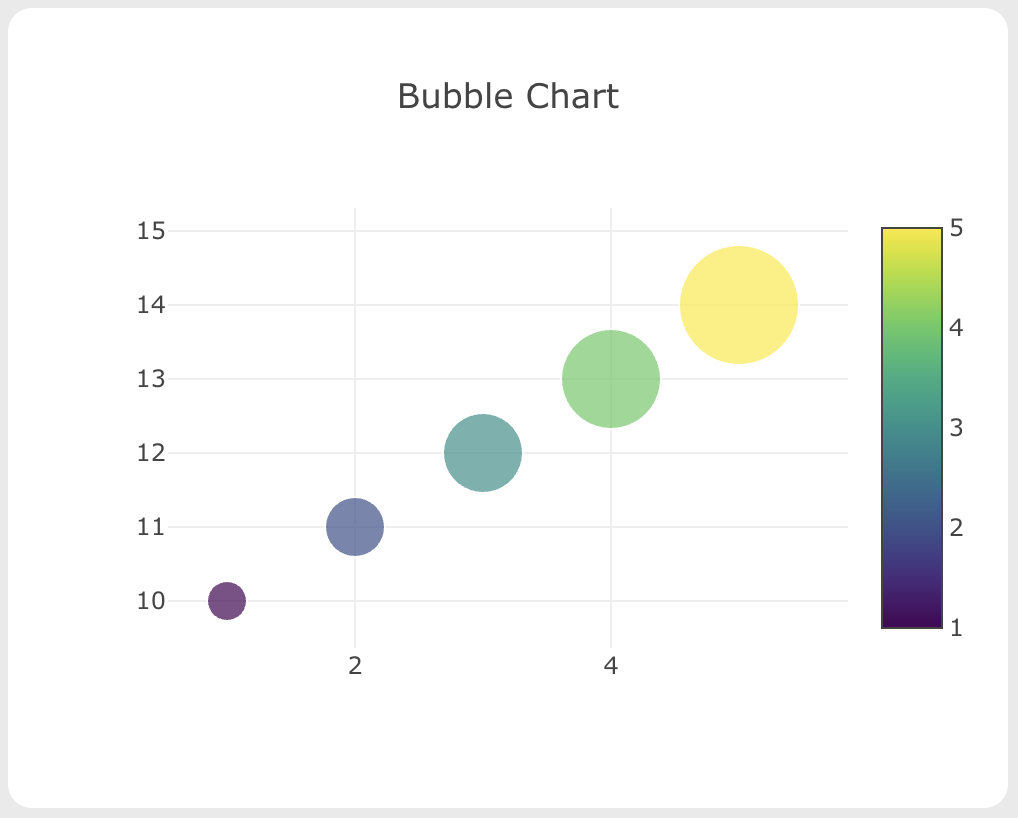
Scatter Plot with Custom Styling
<MarkdownComponentPlotlyChart
  dataJSON='[{"x":[1,2,3,4,5],"y":[10,11,12,13,14],"type":"scatter","mode":"markers","marker":{"size":[20,30,40,50,60],"color":[1,2,3,4,5],"colorscale":"Viridis","showscale":true}}]'
  layoutJSON='{"title":{"text":"Bubble Chart"},"xaxis":{"title":"X Values"},"yaxis":{"title":"Y Values"},"width":500,"height":400}'
/>
Usage Notes
- All JSON strings must be properly escaped and formatted
- Interactive features like zoom, pan, and hover are automatically enabled
- Colors can be specified using hex codes, RGB values, or named colors
- For complex visualizations, refer to the Plotly.js documentation for additional configuration options
- The component renders fully interactive charts that users can manipulate
INFO
You can ask the agent to generate charts dynamically based on data analysis or create custom visualizations for specific datasets.